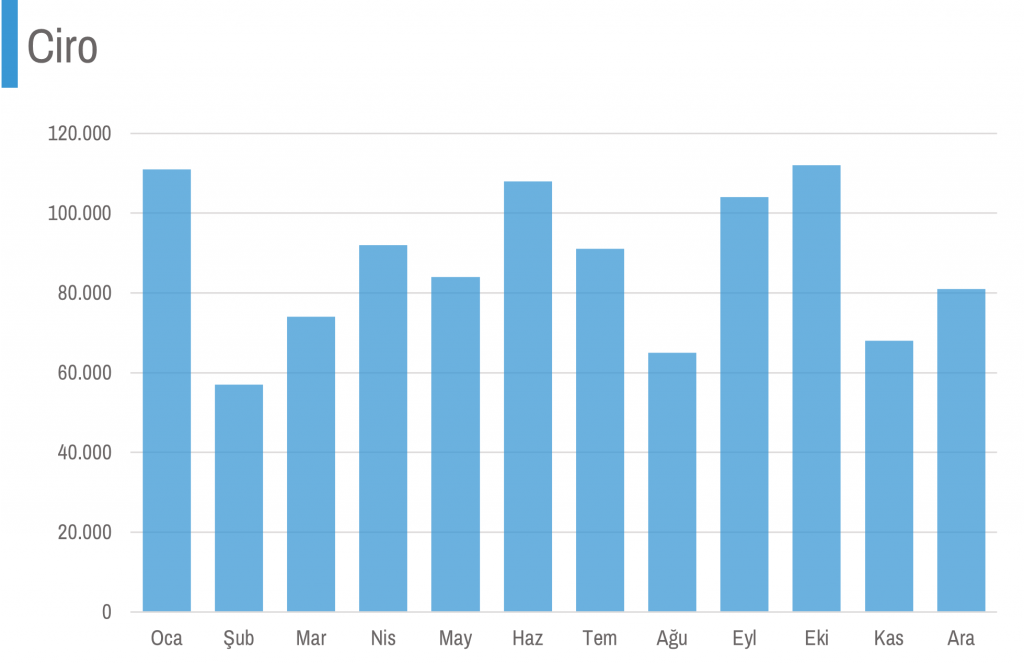
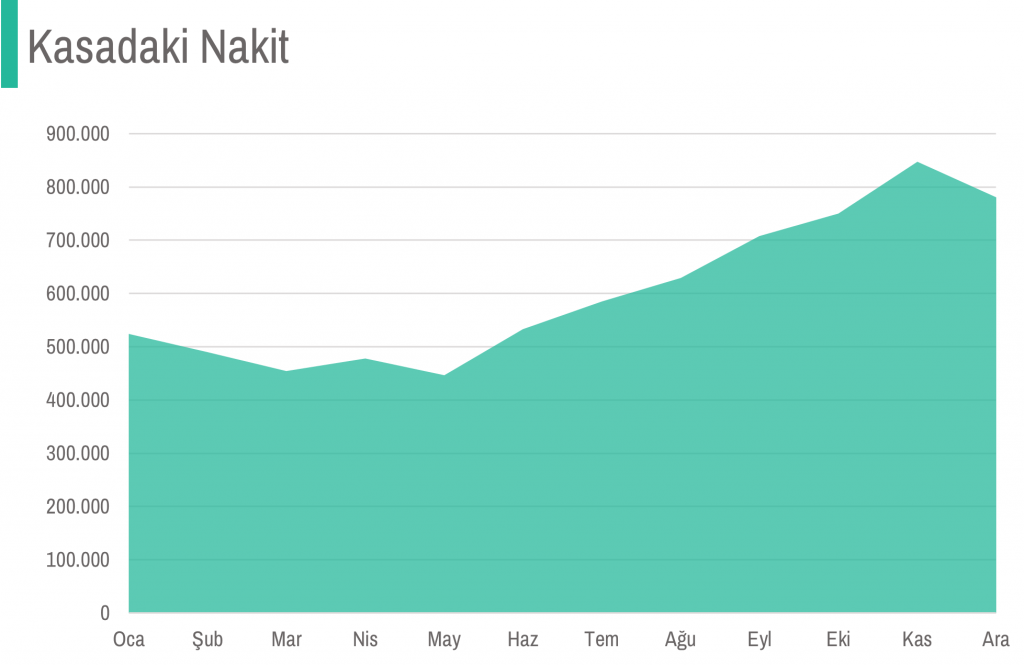
I wanted to raise this question by sharing a post on Linkedin recently: Is there a difference between a column chart and an area chart? If so, what is the reason? Which one should be used in which case?
The examples I used were the monthly turnover and the monthly cash in the cash register. What should we pay attention to when deciding to use columns or area in these examples? In order to answer this question, it is necessary to look at the difference between these two graphs.
One of the Gestalt principles in psychology that helps explain our visual perception is the Connectedness principle. This principle tells us that we think that shapes that are connected to each other have a common meaning, while those that are not connected have independent meanings.
The main difference between a bar chart and an area chart is that the values in these two charts progress independently or in conjunction with each other. The cases in our examples should also be evaluated based on this difference.

In the turnover chart, our monthly values are independent of each other. In other words, the 111 thousand turnover in January and the 58 thousand turnover in February are the values of separate sales, they have no relationship with each other. Therefore, for the turnover chart, it is more appropriate to use columns that visualize the values separately from each other.
The situation is different with cash in the safe. Most of the 490 thousand cash in February is probably included in the 524 thousand cash in January. In other words, they are not completely independent values from each other, they are in the form of another value formed by changing one of them slightly. Therefore, it is more appropriate to create the cash in cash chart with a progressive area that is related to each other, rather than with columns that are visualized independently of each other.

Of course, this is not a strict rule. Although it is a general visual perception truth, our choice of graphs may change depending on the habits of the people who will read the graph and the size of the data.
